What AT&T claims:
At a recent investor conference, AT&T COO John Stankey claimed that AT&T had achieved network operation cost reductions of 6-8% annually for the most recent 5 years, and discussed future objectives including a shift in focus from network operations to SG&A. Clearly, these are laudable numbers; but what do they mean, exactly?
let’s think about this in context. Using 7% (the middle of Stankey’s range) infers a productivity improvement of more than 3 times the national average over the same period – almost startling. If we do the math, it also suggests a halving (50% reduction) in costs, or said differently, a doubling of labor factor productivity, each decade (for simple estimates, use the “rule of 72”).
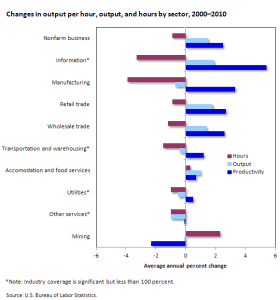
By way of contrast, below is a set of productivity data from 2018, for a set of industrial sectors, courtesy of the US Bureau of Labor Statistics. I want to point specifically to two sectors: “information” technology and “utilities”. IT shows nearly 6% and leads the pack by far. Utilities on the other hand shows more modest 0.5% annual YoY gains. So – has AT&T broken the code and delivered 1100% better performance than its peers? Has it equaled IT, with widely deployed cloud technology? Clearly that’s the long goal, but the vast majority to AT&T’s (or any CSPs) network assets are in the access, feeder and edge RAN, where virtualization is just beginning. AT&T, for example, has just announced trial of “semi edge” cloud technology in partnership with Microsoft Azure.
Therefore, the data leaves me excited, but with more questions than answers.
But what does it mean?
Percentages demand well defined numerators and denominators. I’m scratching my head to understand what each is. The eye-catching headline number begs several questions, so that we can understand both the scope, and the underlying drivers of success:
- What is the scope of network opex? Does it include both inside and outside plant?
- Is this associated with fixed operations, mobile, or a blend of both?
- This may be implied by “network” but does it include any business operations – customer support, billing inquiries, etc?
- Were there any exceptional events that affected the numbers – e.g.: divestiture of labor intensive assets or accounting re classifications?
- To what does AT&T attribute the improvements?
. . . The underlying data can point us to important learnings ,and guide future investments
On the surface we at Appledore are intrigued by AT&T’s progress regardless of the underlying “how” – yet we don;t appear to have enough data to meaningfully process it. Yet the “how” is critical to our collective understanding. its critical to understanding when we have success. Its critical to roll out to others in the industry. And its critical in order to understand what opportunities remain, ready to deliver further gains.
So, is this miraculous progress, or lipstick on a pig? The industry’s future success depends on us distinguishing between the two; and that takes a lot more clarity. Denominators matter!
Grant